
Growing our affluence (proxies) - finding the rich and the rest
Sometimes to get the perfect data, you have to think outside the box. Faced with a data limitation, Clive our Data Scientist, turned to Facebook to answer a few affluence questions
29th September 2021 • Team Thoughts

The Problem
Affluence and propensity to spend are critical factors in many of our store forecasting models. In many countries we are spoiled for choice and can rely on authoritative spend estimates by category, bank transaction data, or direct customer transactions (the heftier the retailer the better).
At a minimum, income data in some form can often be obtained at a reasonable level of geography and, along with other geographically linked data, kicks off the process of understanding the customer.
Countries do come in all shapes, sizes, and levels of data availability however, and in some cases even the stalwart national census is chopped up and rendered less-than-useful at the scales we require.
In these cases, sourcing or creation of useful affluence proxies is essential, as a robust measure can often provide an easy win in understanding current store performance and to help plan a future estate.
The Solution
Having faced this issue in multiple markets we now have an array of metrics to turn to that can serve as proxies for population affluence.
At the very basic end of the spectrum, one could use a top-down approach, disaggregating higher level income or wealth data down to lower geographies. Depending on the type of client and their catchment sizes this may be enough, but for most this approach is too limited.
Oftentimes a more appropriate alternative is to create / source data at as low a level as possible. Keeping specific details light here, we manage to leverage various open, client, third-party, or self-collected data in the hunt to classify geographical areas by wealth.
In some instances though, no single source of truth is robust enough and a stronger measure can be obtained through combinating multiple factors.
A Recent Addition
To this end, and with the release of a ‘Relative Wealth Index’ by Facebook’s Data for Good team and the University of California, Berkeley, we have recently gotten another chance to enrich and validate our current processes.
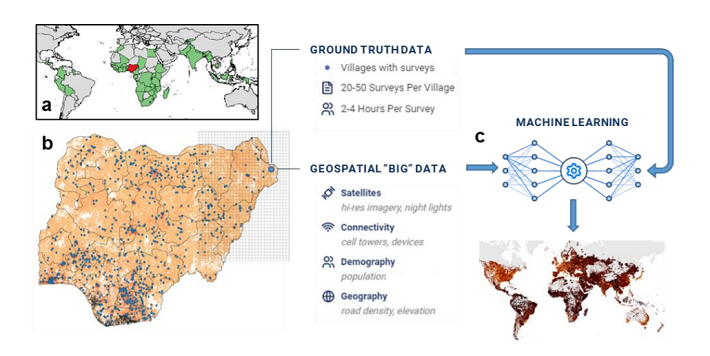
The "Relative Wealth Index" (RWI) provides a measure of wealth for 135 countries at a 2-by-2km resolution and combines data from a multitude of sources including mobile phones, Wi-Fi penetration, road density, household surveys, and earth observation measures into a single measure of wealth (relative within each country).
The paper is well worth a read and details the extensive amount of input data, modelling approach, and validation measures used. As a primer though, a huge amount of data was transformed and fed into a machine learning model, calibrated using “ground-truth” household survey data before again being validated against independent household survey data.
It has been exciting to see how mobile phone data (device counts and platform) were utilised in the RWI, especially as wholistically assessing smartphone ownership is considered to improve household wealth measures.
Case Study
Beginning a new client project in Vietnam, I had kept in the back of my mind that the Facebook/UC Berkeley RWI may be of use.
Using a tried and tested approach for proxying affluence yielded respectable results yet was somewhat constrained to cities, larger towns, and coastal regions. So, as an excuse to test out the new Facebook data, I turned to the RWI.
I had initially considered using it just as a tool for validating our approach, yet it was soon apparent that it would be especially useful in plugging the gaps between cities and provide a solution to the issue of data availability.
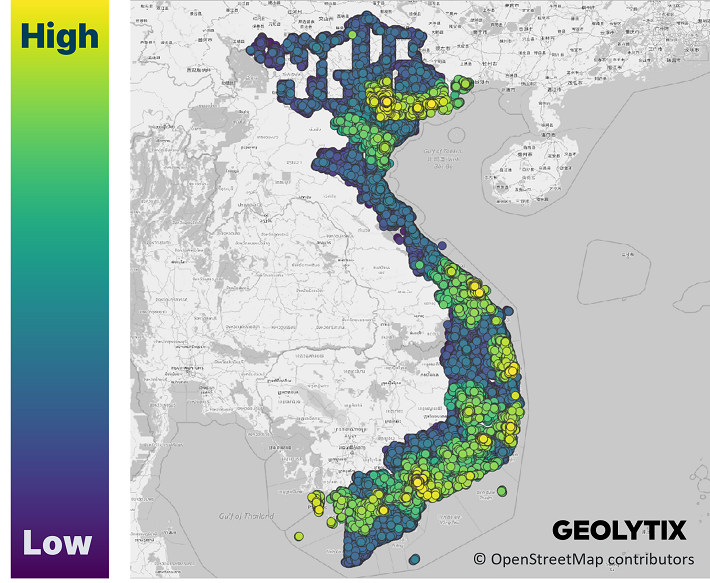
We found that the RWI provided comparatively flatter differentiation within urban areas, yet this was understandable given the 2km resolution. Nevertheless, the general patterns of wealth at both the national and regional levels were broadly consistent with our own.
The correlation between the datasets was convincing enough that, while clearly different measures, they pointed to the same underlying factor of interest.
This led us to combine the strengths of each, namely the national coverage of the Facebook data and the more granular nature within densely populated areas of our data.

In this case, we sought a weighting of convenience for each index that best fit with the client at hand, however, the approach could be easily modified depending on the end goal.
The end result was the integration and a better understanding of an innovative piece of open data and a useful input and validation set to our our internal affluence proxies.
Clive Drowley, Data Scientist at Geolytix

Related Posts
-

The Geolytix Podcast: AI Series
Where location intelligence meets AI. Join Ed Parsons and the Geolytix team for a 6-part podcast cutting through the hype to find real clarity.
Published 1st July 2026 • Tags ai, team-thoughts
-

What’s the Catchment?
Catchments are more than just shapes on a map. Discover 7 ways to map your customers, analyse competitors, and optimise your location planning.
Published 26th May 2026 • Tags team-thoughts
-

HighStreetsPositive - Changing the Negative Narrative
Helping high streets thrive through data, collaboration and community. Read our five top tips with HighStreetPositives.
Published 13th March 2026 • Tags team-thoughts