
Mobility Data – A tale of two IKEA's in Bucharest
Using mobility data, we look at the catchment areas around two major shopping parks in Bucharest - anchored by IKEA stores.
18th August 2021 • Mobility

One of the beautiful things about mobility data is that it is global. Volumes vary by market and quality and cost varies by supplier, but we’ve now used the data in projects across the world for different purposes – from the UK to Thailand, Korea, Australia, Germany, Poland, Kazakhstan, and many more in between.
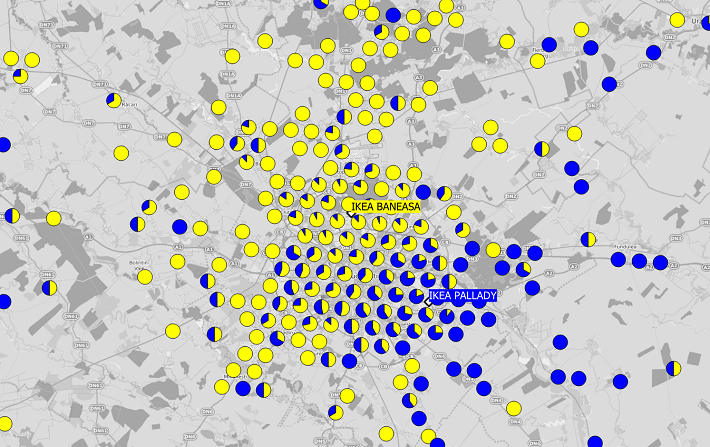
We’ve most recently been using Huq data to look at catchments in Romania, and thought we’d share a nice visual. We’ve looked at two major shopping parks in Bucharest – both of which happen to be anchored by IKEA stores (we haven’t been working with IKEA on this – but if you’re reading this, we’d love to 😊).
We have buffered the shopping parks, identified devices that are active in each, and then linked these back to the suitably anonymised level of geography that is inherent in the data, to allow us to ascertain home location areas.
We’ve then visualised this to show the proportion of devices from any given home location area that are seen in Baneasa in Yellow, and Pallady in Blue, giving us an immediate view of catchment extent and, where there are areas with both yellow and blue, overlap.
The results are reassuringly intuitive – and the great news is, if you’re a retailer in Romania (or anywhere else), and you want to understand your catchment extents and profiles, it’s possible (and maybe surprisingly affordable) for us to do this for your portfolio too.
Please drop us a line to have a chat -
- UK and Europe: ben.purple@geolytix.com or tim.pickworth@geolytix.com
- APAC (and rest of the world): luke.whittam@geolytix.com
Photo by Alexander Isreb from Pexels

Related Posts
-

From Footsteps to Forecasts: The Power of Small Area Footfall
Discover how Geolytix footfall data can transform the way you understand your locations and identify where to open next.
Published 30th May 2025 • Tags mobility, geodata
-

Interaction Surfaces explained: Why Context is Everything
Christoph Mülligann, Chief Innovator at Geolytix, takes us behind the curtain of developing Interaction Surfaces and gives us his unique take on making sense of mobile data.
Published 31st May 2024 • Tags geodata, mobility, mapp, ai
-

Interaction Surfaces: How to maximise store density and minimise overlap
If it was possible to maintain 3 successful stores in one area instead of 2, wouldn’t you want to know?
Published 29th May 2024 • Tags geodata, mapp, mobility