
Opening up the World of Location Planning with COOK
COOK approached us, keen to open more shops and concessions; they requested a toolset that would help support them in understanding and analysing the potential of new locations. Challenge accepted, we got to work...
2nd November 2021 • Team Thoughts
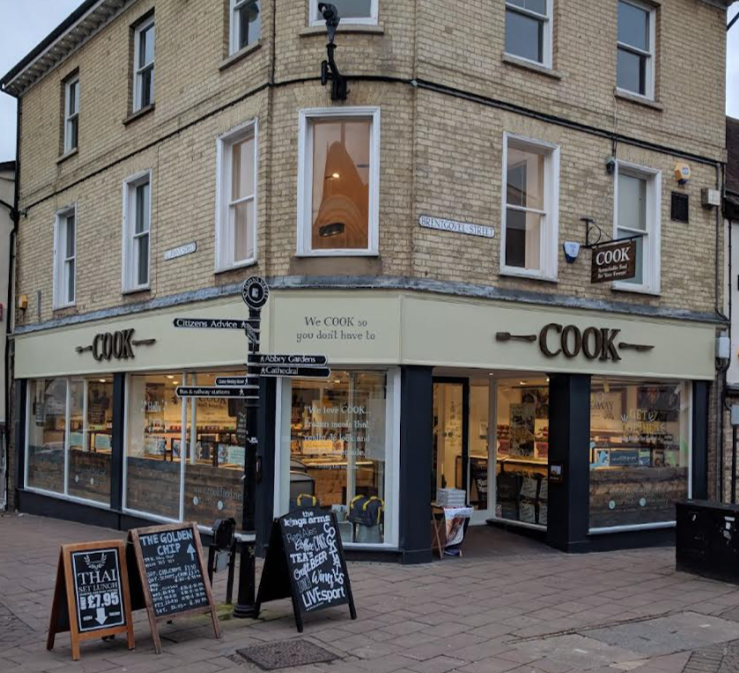
At Geolytix, our #1 value is People. This is one of the reasons I was delighted when COOK got in touch to see how we could help them. “We believe people are amazing” stands out in their driving purpose. One of COOK’s aims is to give good cooks time off from the kitchen; to cook using the same ingredients and techniques that a good cook would use at home, so that all their food looks and tastes amazing. They do this by cooking how you would at home and freezing to preserve.
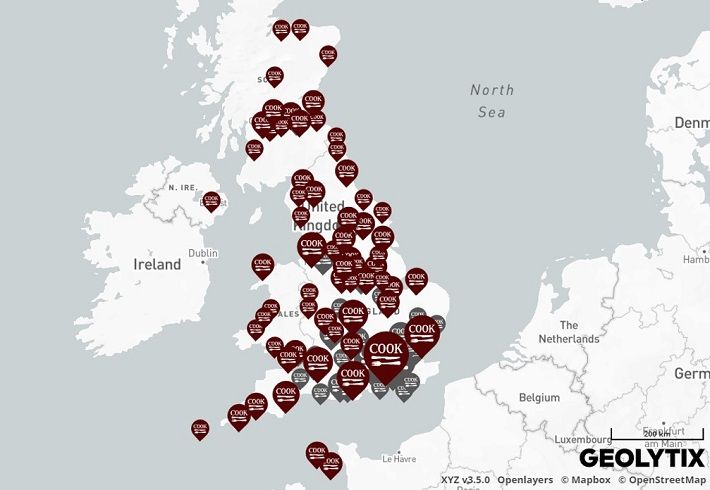
COOK have 92 standalone shops across the UK with proportionately more locations in the South. Their network is supported by 3000 or so freezers stocked in over 800 concessions across the nation, predominantly in independent and cooperative retailers. This gives access to 50% of the population within a 10 minute drive.
COOK are keen to push this further by opening more shops and concessions and wanted a toolset to support in understanding the potential for new locations.
Our challenge was set:
Understand the customer
- What type of people are more likely to buy COOK products
- How does this differ by those that get it delivered and those that visit the shop
Understand the catchment
- How far do people travel to a COOK shop?
- Are Customers more likely to get COOK products delivered online if they live nearer to the shop
Understand the potential of a new location
- What does the catchment look like?
- How does it score?
- How does it compare to the estate and similar shops?
Make it easy to access real-time information for everyone
Understanding the customer
COOK already know a lot about their customers. Collating their anonymised data on where their customers live, allows us to strip out the effect of location. Does a certain type of person shop at COOK more because they love the brand, or because they live nearby? We were able to provide an index for age, affluence and other geodemographic measures.
Understanding the catchment
Using COOK’s customer data it’s possible to create decay curves, which show how far customers are willing to travel to a shop. We do this by different urbanities, as rural folk are generally happy to travel further. We were particularly interested in this; we have done it umpteen times for the grocers we work with, but never for a retailer where their entire range is frozen.
We assumed that the online customer decay curve would be a flatter profile – this is to be expected as the customer doesn’t have to travel, but also because the products can travel in refrigerated vans. This was true, but as we often see an online halo does exist.
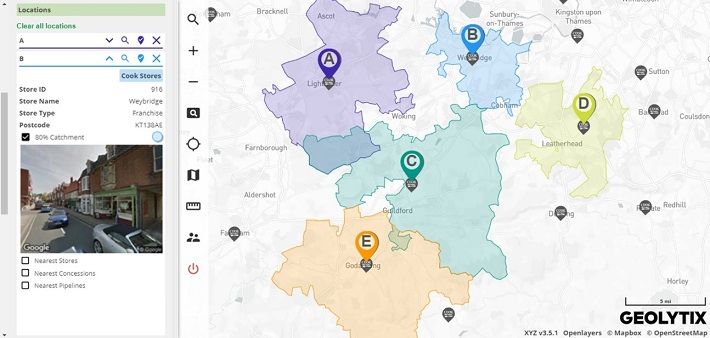
80% catchments
80% catchments highlight the area around a shop where COOK’s top 80% of sales come from. This strips out tourists and one-off visits to highlight the typical extent of travel, and potential catchment for each store. It also helps in visualising whether 2 stores have a high level of overlap and potential cannibalisation. Here we see that the Cook shops around Guildford have been well located. An obvious question from looking at the map is around the sales potential in Woking and possible cannibalisation on the 3 surrounding shops.
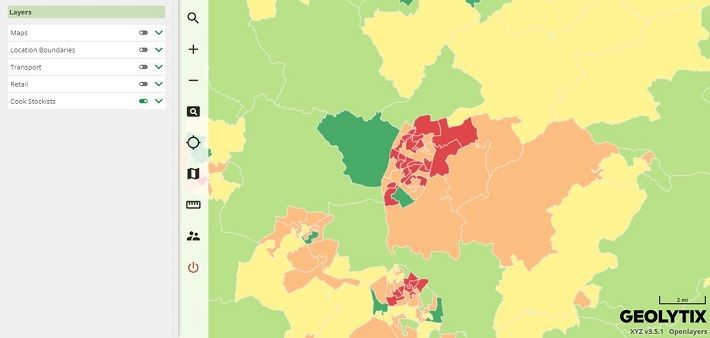
Geolytix MAPP
To date over 20 COOK colleagues have signed up to Geolytix MAPP, across a number of different functions. COOK have embraced our system (thank you!), with different people asking for the addition of different operational boundaries or different elements in the reporting – each request making it more useful for everyone.
Hot spot propensity mapping layers, along with demographic reporting for any site allow potential leads to be viewed instantly. Automatic links to real-time sales reporting allows recent performance for existing shops and new shops to be accessed wherever colleagues are, in the office or out in the field.
Chris Portwood, Chief Sales Officer, says:
“Geolytix has helped us sophisticate our thinking around new space and although we are still learning their system, we have already seen that the rich functionality will undoubtedly help us to make better expansion decisions in the future. They are also great to work with as nothing is too much trouble”.
The next tools in the COOK toolbox are a benchmark (analogue) model, and an overlap report, to understand cannibalisation of the existing estate. Watch out for the next blog instalment for more information.
Sarah Hitchcock, Chief Operating Officer at Geolytix

Related Posts
-

What’s the Catchment?
Catchments are more than just shapes on a map. Discover 7 ways to map your customers, analyse competitors, and optimise your location planning.
Published 26th May 2026 • Tags team-thoughts
-

Leeds and the 15-Minute City: A Retail Perspective
Leeds, the biggest city in Europe without a mass transit system. That is set to change. Freddie Wallace explores the benefits and challenges while evaluating the idea of a 15-minute city.
Published 10th March 2025 • Tags team-thoughts
-
The Importance of Site Visits for Location Planners
While data driven insights are essential, site visits are indispensable for Location Planning. Alison interviewed our Location Planners to find out why we do them and 10 top tips that might help you next time.
Published 1st June 2023 • Tags market-visits, team-thoughts