
Retail Recovery - Que Sera Sera?
We’re often asked what a good level of forecast accuracy looks like. The answer is always: it depends. Some things are hard to forecast. Really hard. Even harder than convenience store turnover. Like, will things ever return to normal?
29th June 2020 • GeoData
There’s no shortage of views and opinions. “UK will be back to normal by August, says WHO expert” on one hand. “We must shake off the fantasy that we can go back to the past we are accustomed to”, says the mayor of Seoul on the other.
There’s obviously only one thing to do when faced with such a difficult forecasting problem: ask Geolytix.
Unfortunately, as Doris Day said, the future’s not ours to see. There are a whole number of scenarios that might unfold, each of which will have a different implication for different businesses. Depending on which come true, it will shape the property decisions – where to open, where to close. It will drive the format decisions – what type of offer to put where. It will determine the in-store, home delivery and click and collect requirements of a physical estate. It could mean tweaking around the edges, or it could mean a complete overhaul of a portfolio.
To move the discussions from a ‘he thinks, she thinks’ view of the future, people are increasingly looking to data to help shape their understanding of what is happening. Mobility data is being used to understand activity levels – how many people are out and about, where are they going, what are they doing?
We’ve historically been what we’d describe as ‘healthily sceptical’ of mobility data, for 3 main reasons. Firstly, for a long time, the quality of the data was underwhelming; it promised so much, but on close inspection could never quite get to the level of granularity and accuracy that would make it compelling to understand micro-level pitch. Secondly, it was very black box, and the inherent flaws and skews in the data were impossible to get under the skin of and mitigate. Thirdly, it was expensive; often prohibitively so.
But – it’s near real-time, and in the scenario-modelling of the future, that’s a huge advantage. So we’ve been investing an enormous amount of time, money and effort in mitigating the issues that have made us healthy sceptics in the past.

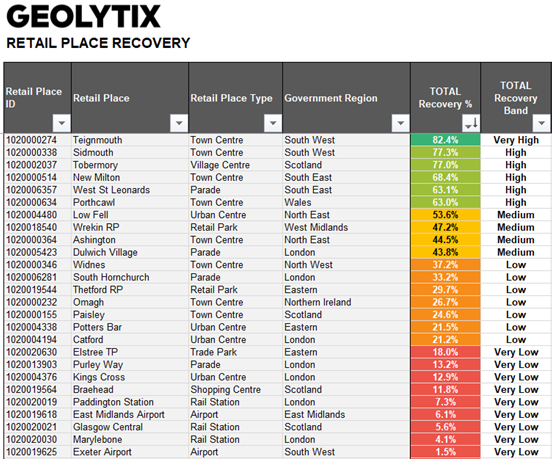
What we’ve ended up with as a result is 15 billion pings of high quality, highly granular location data over the last year and a half, with a feed adding to that number every day. That allows us to truly understand the data and be completely transparent with clients about it. It allows us to build things like our Retail Recovery Index but also use the data to answer a huge array of bespoke client questions (where is the optimal pitch at lunchtime in city centre x, where are customer around store y coming from, what’s their demographic profile, where were they an hour before they were in the vicinity of the store?).
The Retail Recovery Index is telling the same headline story that is being reported across the national press (we really need to get some friends in the media – if you know anyone, please shout!). Overall, recovery is cautious, the opening of non-essential retail gave a visible boost to activity levels in city centres and shopping centres, and there is a regional skew, with London lagging.
That’s obviously very reassuring in terms of the data all saying the same thing, but the real value is in the golden nuggets of detail under the surface, and the way that the spatial differences in recovery map across to individual branches and businesses.
Recent headlines like ‘Shopper numbers surged 45% in week English shops re-opened’ might be a true footfall measure from a camera-operated major shopping centre, but for an operator with a portfolio balanced across parades, High Streets and town centres, that’s obviously not what’s really being seen. Linking to our Retail Places gives us a daily read on over 6,000 diverse locations across the UK, and clients are benefiting from the ability to geofence around their estate to get a bespoke read of the recovery around their estates.
In short, the picture is complicated, and uncertain, and highly changeable. In the absence of a crystal ball, the ability to map the data to the specific areas around stores within any given portfolio, get a regular up to date feed of how activity is changing, and use that to simulate the most likely scenarios might be the best we can do.
If you would like to find out more, please get in touch with Ben (ben.purple@geolytix.com) or Tim (tim.pickworth@geolytix.com).
Data for the above charts and graph is for w/c 19th June
Title Image: Photo by Joe Stubbs on Unsplash

Related Posts
-

Fast Food in Reading - A National Benchmark?
Using Geolytix Retail Universe, Josh maps the UK’s fastest-changing QSR hotspots and where the next wave of growth may emerge.
Published 23rd June 2026 • Tags market-visits, geodata
-

Grocery Growth: UK Supermarket and Convenience Changes in 2026 Q1
Convenience-led growth and selective closures have defined the UK grocery sector in the first quarter of 2026, as retailers continue to reshape their store networks.
Published 30th April 2026 • Tags open-data, geodata
-

Beyond footfall: where retailers really outperform in London
Card spend data reveals where London retailers actually outperform their own estates. From high-conversion rail hubs to high-productivity retail parks, discover the locations driving real growth.
Published 16th February 2026 • Tags geodata